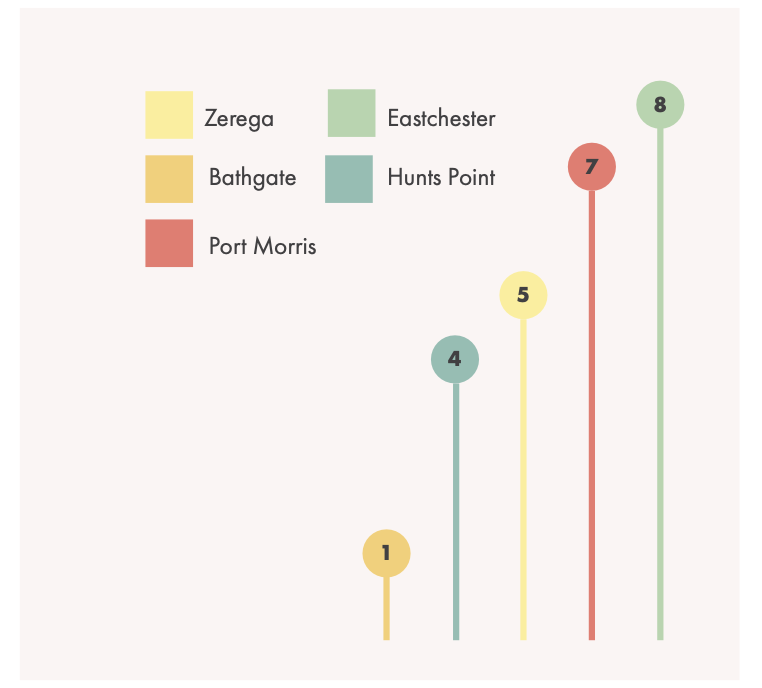
I designed the layout of these reports and also a structure as to how to present the information. There was a lot of data that had to be included and previous versions had contained simple bar and pie charts. I used Tableau and Excel outputs to create custom visualizations that better suited the look of the reports and had more visual appeal.


Previous
Previous